Technical analysis is an approach used in trading to anticipate the evolution of a market price, in order to optimize entry points (buying) or exit points (selling).
Not to be confused with fundamental analysis, which consists of determining the intrinsic value (real value) of a project, technical analysis is based on the past activity (history) of an asset’s price, in order to predict at best its future movements.
Note that technical analysis is not only limited to the stock market but can also be approached in the market of cryptocurrencies, futures, commodities, and much more. In fact, all you need is a chart along with some trading tools to track the price of an asset and that’s it, technical analysis can begin.
Is the time frame important in technical analysis?
Yes, it is very important to select the right time unit(s) depending on the period you want to trade. The analysis of a price using a high time unit (e.g. 1D, 1W…) will in fact have much more value in the long term (in theory) than with a small-time unit (e.g. 10m, 30m, 1h…).
In other words, the time unit you use must correspond to your trading strategy (scalping, swing trading, hold…).
What are the different styles of indicators in technical analysis?
The ecosystem of technical analysis includes many types of indicators. Some are simpler to understand than others, but they all increase the relevance and accuracy of analysis, as long as they are used correctly.
Here are the main elements on which you can base your technical analysis:
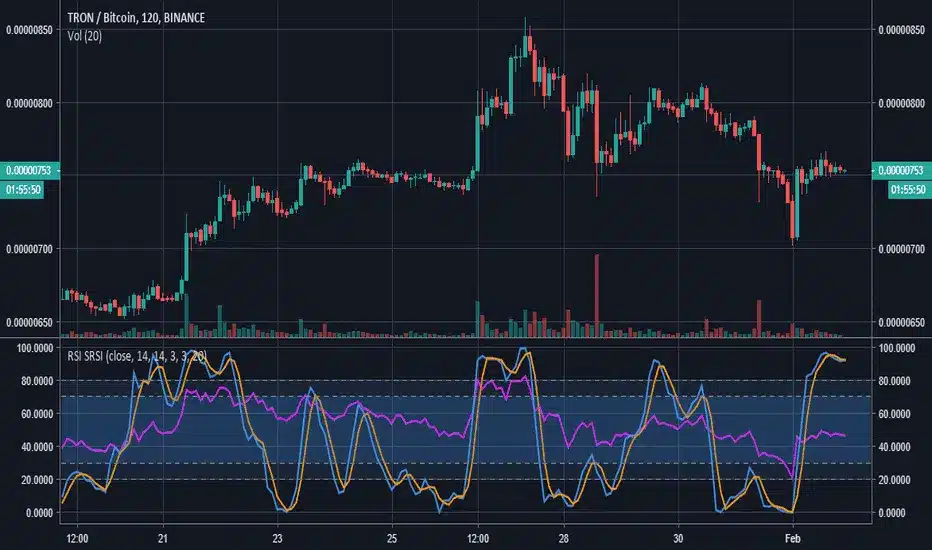
- Technical indicators: Trading tools that are very popular with traders. Technical indicators allow you to bring more precision and relevance to your analysis.
There are several types of technical indicators, such as “oscillators“, which include MACD, RSI (Relative Strenght Index), but also trend indicators such as moving averages, Bollinger Bands, or Ichimoku, to name only the most popular.
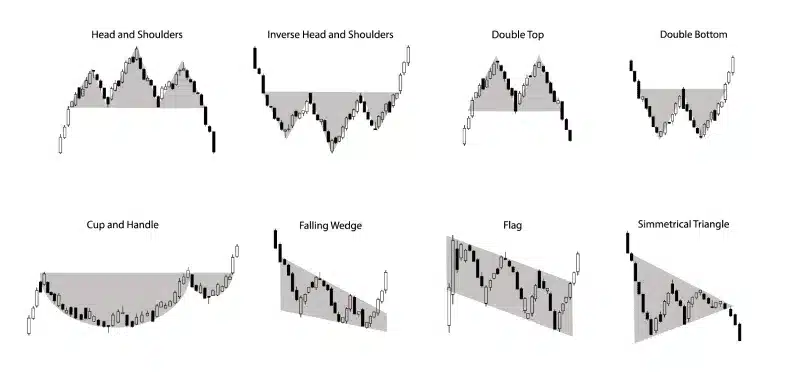
- Chartist patterns : Chartist patterns are used to identify new “chart patterns” that the price of an asset traces during its movements. Once validated, these patterns indicate to traders the potential confirmation of a trend.
You are probably familiar with the “W” (double bottom), the “M” (double top) which are probably the most well-known patterns in the market. There are also bullish and bearish channels and compression triangles. The list is far too long to mention them all.
Is technical analysis 100% reliable?
No, technical analysis is just a probability game, used to optimize your investments, but is by no means 100% reliable. There is no guarantee that the market will behave as you think it will.
Nevertheless, it is always important to base your technical analysis on several indicators and not just one, in order to strengthen your trading strategy and your intervention in the market.