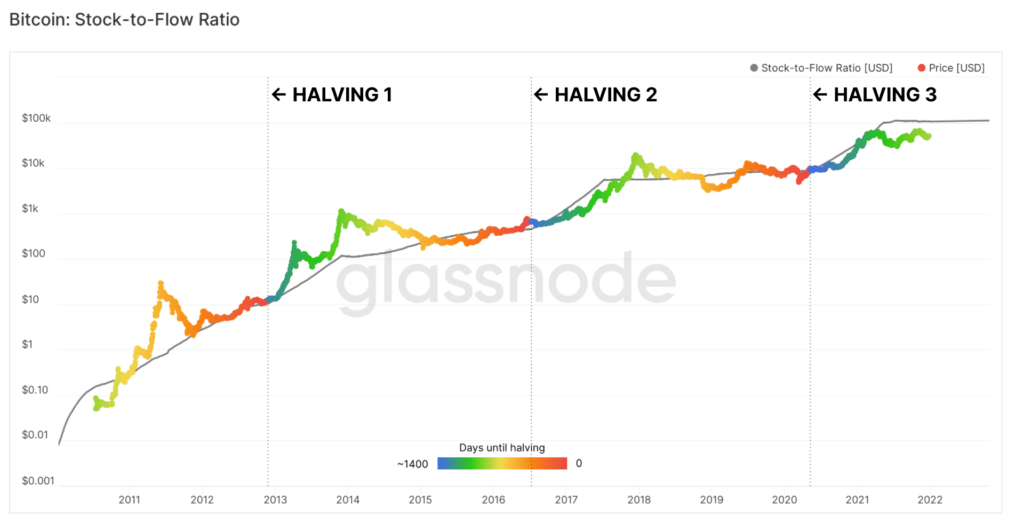
Bitcoin is a very volatile financial asset even after more than 10 years of existence. Halvings, which by definition correspond to the division by two of the reward per block for Bitcoin miners, take place every 4 years. These events have so far triggered a bullish rally each time, more commonly known as a bull market.
As these market periods are extremely powerful, economic decline is then inevitable. We then enter a downward trend or bear market. And since Bitcoin reflects the health of the entire crypto market, when its price becomes bearish and falls significantly for several months, the value of other crypto-currencies suffers even more. Indeed, investors do not hesitate to get rid of it when the climate is uncertain, to hedge their portfolio.
What is a bear market in the crypto market? Definition and explanations
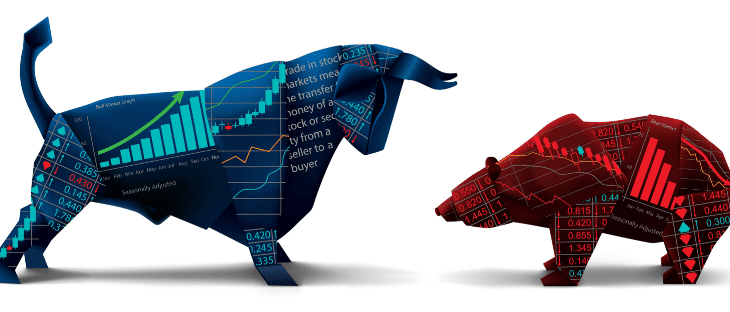
A bear market is a price correction and downward trend that lasts for several months or years. This term comes from the stock market world and is the opposite of a bull market.
These two animals are not randomly chosen, the bear punches his opponent from the top down, while the bull lifts him by the horns from the bottom up. Usually, by definition, a bear market is a decline of more than 20% in assets.
With the extreme volatility of the crypto market, the bear market corresponds rather to a drop of about 80% of Bitcoin. The decline is even more violent for altcoins, sometimes minus 98%, i.e. a price divided by 50! Confidence in the crypto market is very low, and on average, most retail investors are disgusted and lose interest in the topic.
The different bear markets in the crypto market
In June 2011, Bitcoin reached $32. The first long downward correction then took place, sending Bitcoin back to a value of $2 in November of the same year, i.e. 94% correction. It was not until February and March 2013 that a new ATH (all-time high) took place.
In November 2013, Bitcoin was quoted at over $1200. After this bubble phase, the bearish phase starts and the price drops by more than 85% to a low point of almost ~$170 in August 2015. After 4 years of waiting, investors were able to see the price of Bitcoin rise to $1,000 again, the trend becomes bullish, and Bitcoin reaches almost $20,000 in less than a year.
Following this very bullish period, Bitcoin falls for a full year to $3000. And when Bitcoin sees its price divided by 6 in one year, the price of the second-largest cryptocurrency, Ethereum, is divided by 20. But other corrections can also occur without being bear markets:
| Correction period | Duration (days) | Bitcoin high point | Bitcoin low point | % decrease | Duration in days before returning to ATH |
| 10/11/2021 to 04/12/2021 | 24 | 69000 | 41960 | -39% | ? |
| 14/04/2021 to 22/06/2021 | 69 | 64895 | 28600 | -55% | 189 |
| 08/01/2021 to 22/01/2021 | 14 | 42000 | 28800 | -31% | 31 |
| 26/06/2019 to 13/03/2020 | 261 | 13880 | 3850 | -72% | 493 |
| 17/12/2017 to 15/12/2018 | 363 | 19783 | 3130 | -84% | 1095 |
| 08/11/2017 to 12/11/2017 | 4 | 7879 | 5507 | -30% | 8 |
| 02/09/2017 to 15/09/2017 | 13 | 5014 | 2951 | -41% | 40 |
| 11/06/2017 to 16/07/2017 | 35 | 3025 | 1837 | -39% | 55 |
| 10/03/2017 to 24/03/2017 | 14 | 1326 | 892 | -33% | 48 |
| 30/11/2013 to 14/01/2015 | 410 | 1166 | 170 | -85% | 1181 |
| 10/04/2013 to 07/07/2013 | 88 | 266 | 63 | -76% | 211 |
| 08/06/2011 to 17/11/2011 | 162 | 32 | 1,99 | -94% | 631 |
| 13/05/2011 to 21/05/2011 | 8 | 8,45 | 5,58 | -34% | 12 |
| 10/02/2011 to 04/04/2011 | 53 | 1,10 | 0,56 | -49% | 66 |
| 06/11/2010 to 10/11/2010 | 4 | 0,50 | 0,14 | -72% | 86 |
| 14/09/2010 to 08/10/2010 | 24 | 0,17 | 0,01 | -94% | 40 |
What are the signals that may indicate a bull market top and a looming crypto bear market?
The analysis of previous bull runs, as well as some indicators, can help us understand where we are in the current bull run. Beware, however, that we cannot accurately predict the evolution of the Bitcoin price based on analyses of past phases.
The indicators that will be presented are only indicative, and should not be used as the sole basis for your strategy (find your own investment strategy). It is always wiser for an investor to learn how to take profits on his investments, as it is impossible to time a bull market top perfectly.
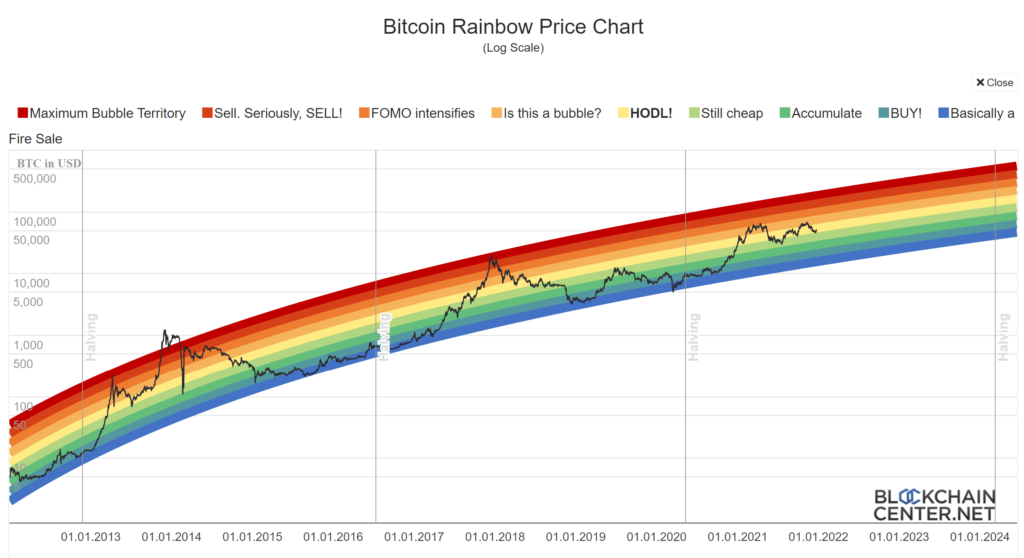
The Rainbow Chart
Let’s start with one of the most well-known long-term indicators, the Bitcoin Rainbow Price Chart. Bitcoin seems to move between 2 logarithmic curves since its inception, this “Rainbow Chart” represents the price movement between these curves. It is famous because it was created in 2014, and the price has followed the pattern remarkably well since.
As shown on the chart, on average, it is attractive to buy in the green-blue areas and sell in the red. The upper bound is currently at about $180,000, and the lower bound is at $16,000. Note that over the year 2021 the price has wisely remained between the light green “still cheap” zone and the orange “is this a bubble?” zone.
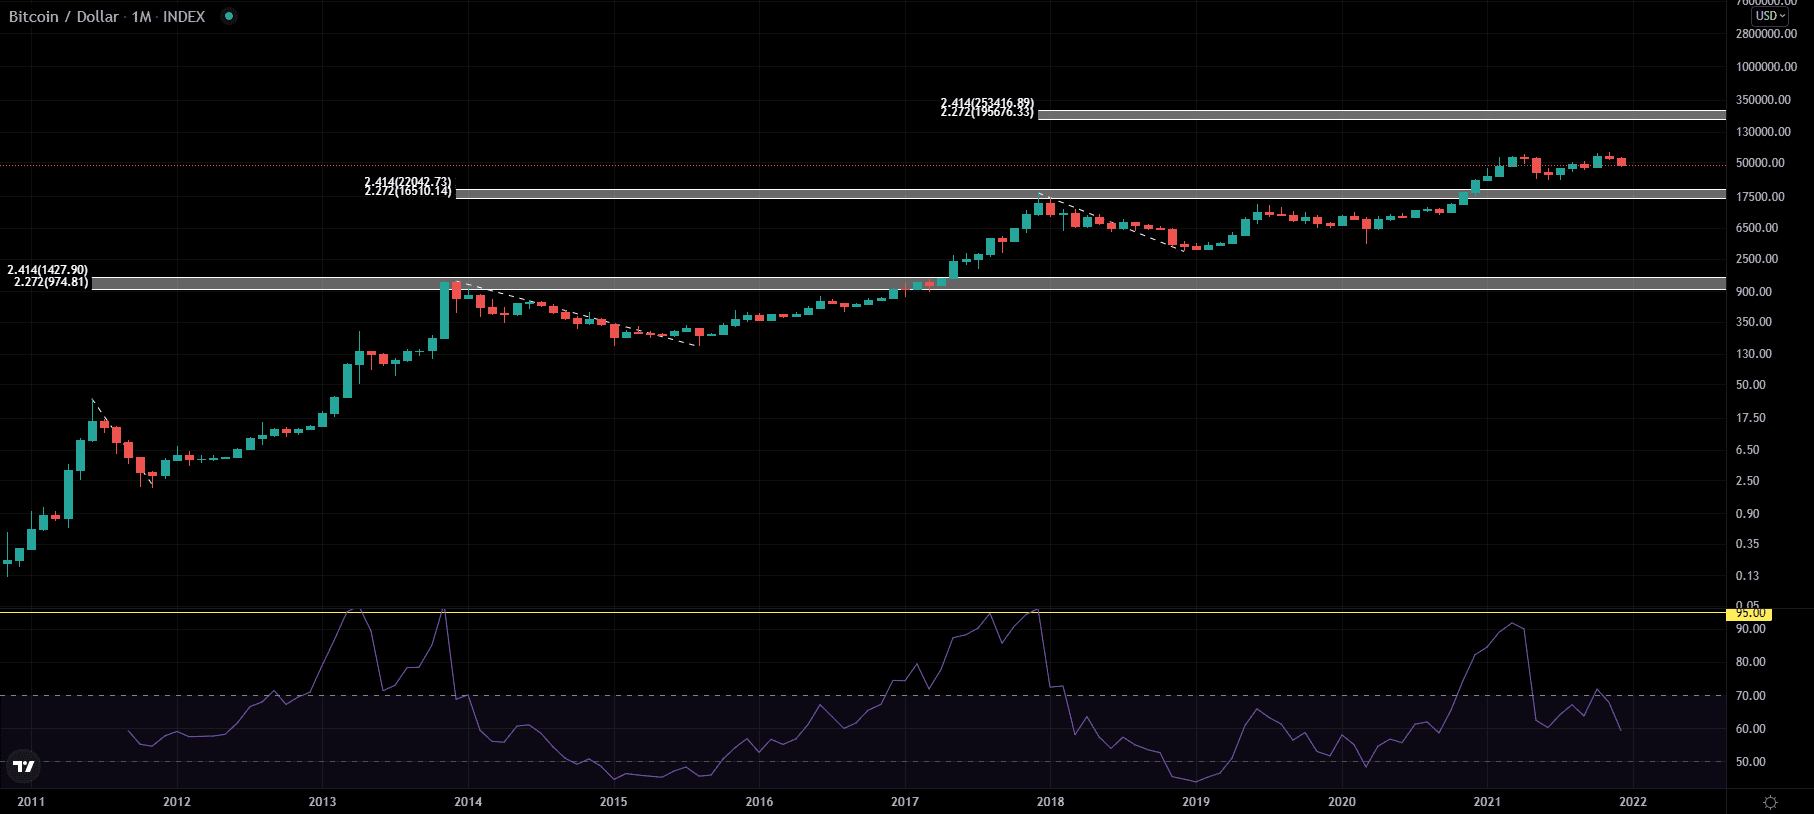
Fibonacci extensions and RSI
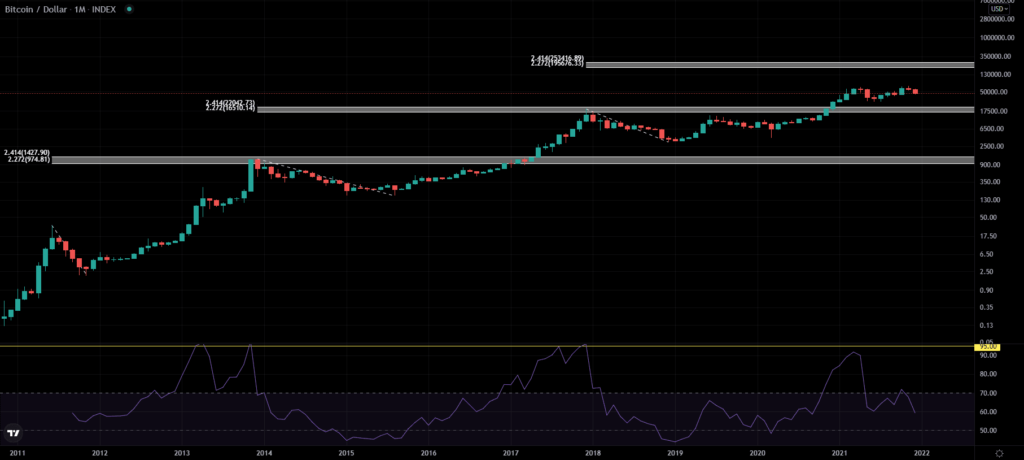
On this graph, there are two important pieces of information represented that could help when you are investing or trading. Firstly, the Fibonacci extensions. Leonardo Fibonacci’s mathematical sequence is one of the most well-known sequences in the world. It is found in many areas, as is the golden ratio, 1.618, which is the best-known ratio. 2.272 and 2.414 are also Fibonacci ratios.
With the help of Fibonacci, we can see that in the previous two cycles, Bitcoin found its top between the 2.272 and 2.414 extensions. If history repeats itself, BTC will find a top between $195,000 and $253,000. These price targets are consistent with the Rainbow Chart data.
The purple indicator at the bottom is the RSI (Relative Strength Index), it indicates the Momentum of the market. Its calculation is based on the average rise and fall over a certain period of time, its scale goes from 0 to 100. The asset is considered oversold below 30 and overbought above 70. During the two previous bull markets, the indicator made a double top at around 95. So far, we have only had one peak. If the market goes up again, it will be interesting to sell if we get back into this area.
MVRV Z-Score
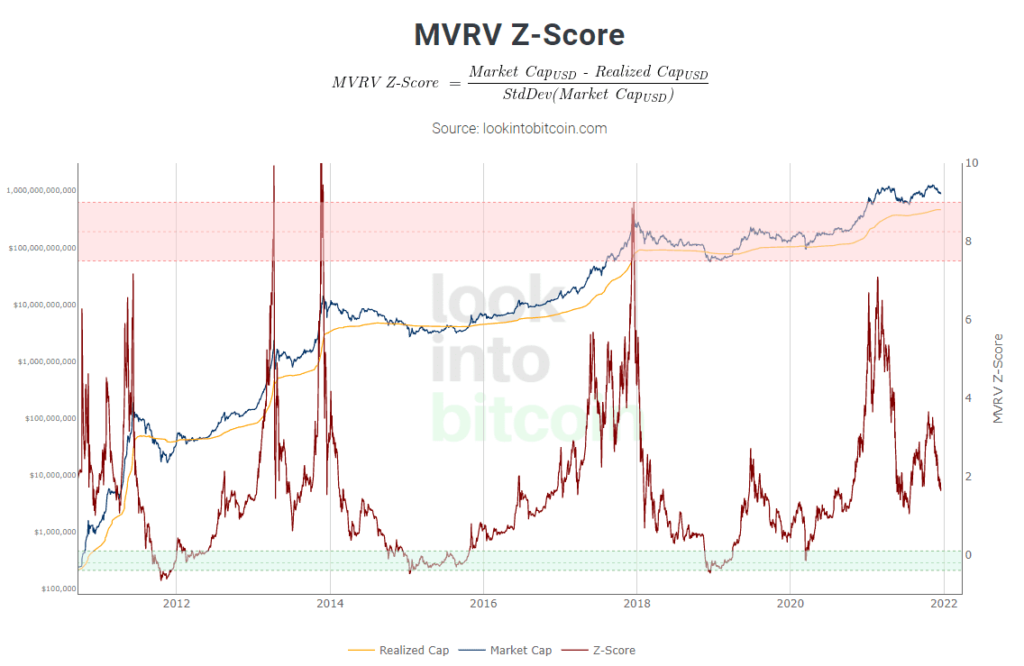
MVRV stands for “Market Value to Realized Value” in English. This graph represents the MVRV Z-Score indicator, which is calculated using data found on the blockchain, namely the “Realized value”. To calculate it, we take the price of each Bitcoin on the date of the last time it was transferred. These prices are then averaged and multiplied by the number of Bitcoins in circulation. The Z-score, which is then calculated by taking this value and the total capitalization of the cryptos into account, is shown on the graph between 0 and 10. With the help of this indicator, we can see that the green boundary is an interesting buying zone and the red boundary is an interesting selling zone.
RHODL
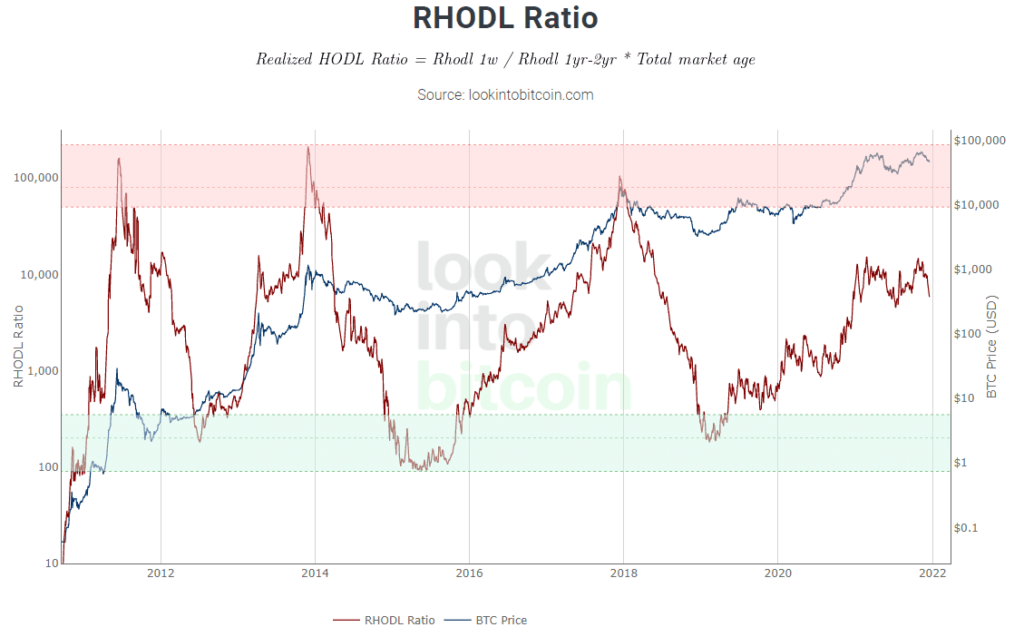
RHODL stands for “Realized HODL Ratio” in English and is a market indicator based on the ratio of Realized Cap HODL Waves. The RHODL indicator is also calculated using on-chain data. Once again, the “Realized Value” comes into play. The indicator makes a ratio between bitcoins that have moved recently and those that have been held for 1 to 2 years. It has a considerable advantage over all other such indicators: it does not show a top for the first bull market phase in 2013 where all other indicators do.
These indicators all point to the fact that we are in a bull run that is missing another big bullish period. However, we need to remain measured and remember a few things:
- The indicators based on blockchain data were all created in 2018/2019/2020.
- Past cycles do not predict future cycles
- The market has changed a lot since 2013 and 2017: many more institutional players are present, the market is still more manipulated by famous people and by market makers who will look for liquidations of future contracts, the market cap is much higher and therefore the price less likely to explode as in the past, etc.
- The external context influences Bitcoin a lot today: health crisis, correlation with traditional finance (S&P 500, long term bonds), FED policies on rates, etc.
Take profits and reduce risk before the bear market hits
When the market top has occurred and there is a drop of several tens of percent in a few days on Bitcoin, it is very difficult to sell on the overcrowded centralized exchanges. And since it is impossible to sell the top unless you have a huge chance, it is better to exit the market gradually. On the way up you can for example apply a reverse DCA.
Investors should also not panic when days with very violent corrections follow each other after the top. Historically, the BTC price has always retraced 61.8% to 78.6% (Fibonacci level) after making its top, and before continuing its slow and painful fall. In 2013, it fell from over $1,200 to $450 in a fortnight, but then recovered to $1,000 three weeks later. Same scenario in 2017: the price is almost divided by two between December 17 and 22, but the bounce following the fall brings the price back to $17,000 2 weeks later. These “dead cat bounces” are therefore an excellent way out.
Exiting the market does not necessarily mean selling all your crypto-currencies and withdrawing the money from your portfolio or bank account. Several solutions are possible:
- Place your stablecoins on DeFi and CeFi protocols to earn interest on your investment. You can find our comparison of the different solutions here. The rates will be a bit lower during the bear market but will still be more attractive than many other investments. Remember to diversify stablecoins and platforms to reduce your portfolio risk.
- Keep stablecoins to short the market. If you think the market is going to correct for several months, you might as well make money on the decline.
- Sell only altcoins. BTC may suffer a violent correction, but if you’re a convinced long-term investor, you probably think it will go back up eventually, and you can hold. It’s a different story with altcoins. Many projects fall to 0 and never rise again, so you have to be even more careful than with Bitcoin.
- Diversify your investments: if you have made money during the bull run, the share of crypto-currencies in your overall portfolio has probably increased. You can therefore invest your capital in other less volatile financial markets (gold, stocks, shares, real estate).
Then comes the most interesting part: buying when everyone else has capitulated! When most investors are losing interest in the market and are losing money on their portfolio; when the fear and greed index is in fear for several months; when some states are banning Bitcoin for the 22nd time for their citizens… This is certainly the time to make the best investments.
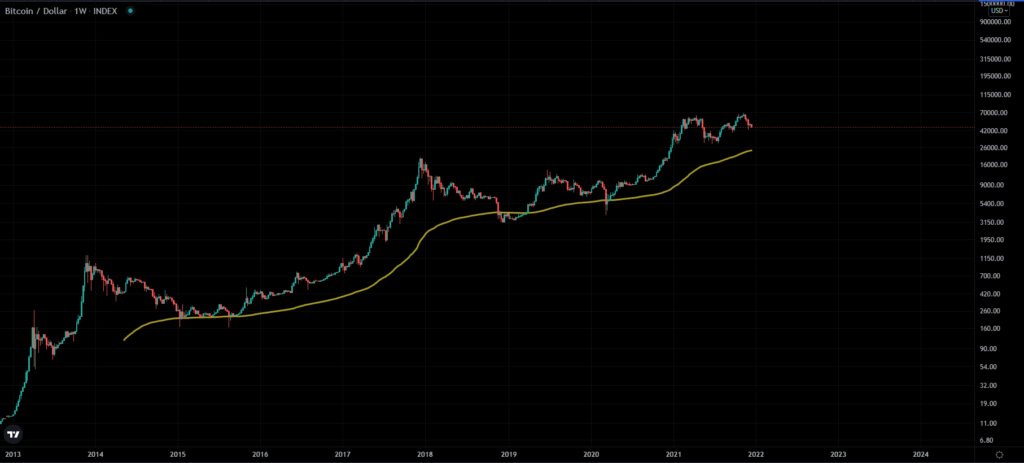
You can use the logarithmic curve as a guide, or the other long-term indicators discussed in this article. The 200-week exponential moving average has also done well for the price in recent years. It currently stands at $24,000.
The cryptocurrency market is becoming more mature, institutional confidence is there, and there is every reason to believe that the cycles, both down and up, will be less volatile in the future. We cannot be sure that the market will continue to alternate economic bubbles and corrections every 4 years. Indeed, halvings, by their very nature, will have less and less impact in the long term.
Important: Trading or investing in cryptocurrencies carries a high level of risk, and may not be suitable for everyone. This article is for educational purposes only and does not constitute recommendations or encouragement to trade financial instruments. Manage your investment risk.
Sources
- The Fibonacci sequence: https://dl.farachart.com/pdf/010_TheSecrets_Of_Fibonacci.pdf
- Understanding the RSI indicator: https://www.investopedia.com/terms/r/rsi.asp
- Understanding the RHODL ratio, HODL waves, and Realized Value: https://positivecrypto.medium.com/bitcoin-realized-hodl-ratio-9023db15a559
- Indicators based on blockchain data: https://www.lookintobitcoin.com/